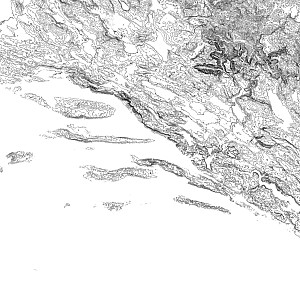
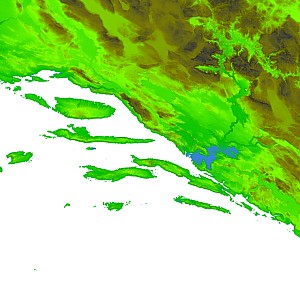
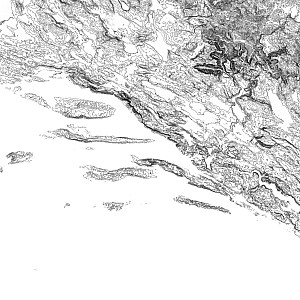
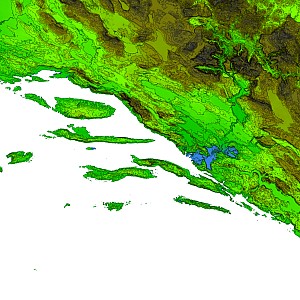
How to create your own topographic map
Croatia Showcase
Have you ever thought about creating your own topographic map and did not know where to get all the necessary hi-resolution data? Even better, create your own topographic map without paying big $$$ for the data and commercial GIS software?
Then this showcase will show you how to achieve just that.
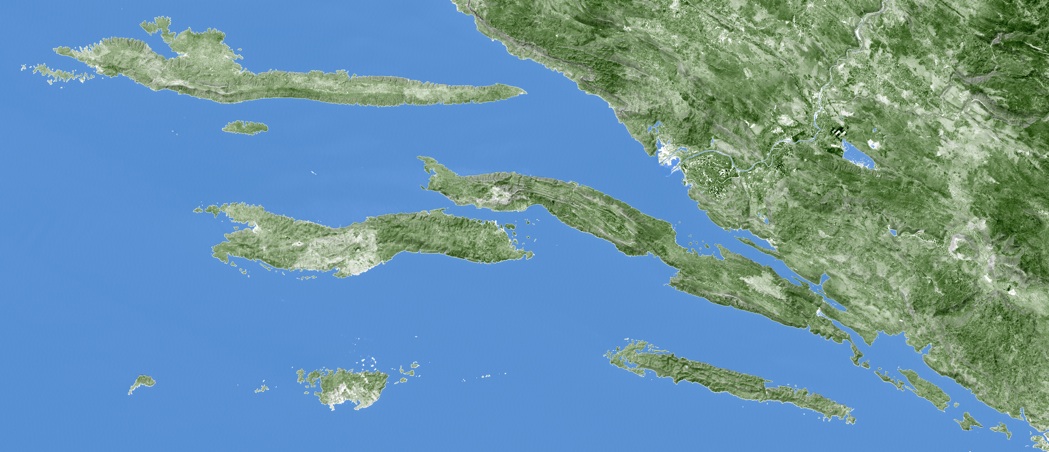
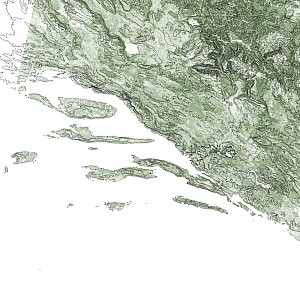
For you impatient folks here is a teaser of what the result looks like:
Getting Started
So, here is what we do to make our topographic map:
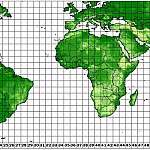
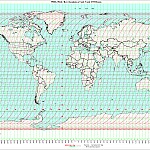
We are locating the area on the worldwide coverage map for SRTM data (see image on the right) of the Space Shuttle Radar Topography Mission in 2000, which gathered elevation data for the entire world with 90m spatial resolution. The data is provided in a grid (or tileset) with 72 columns and 24 rows.
Side note: 90 meter spatial resolution may not sound quite as good as 1:25000 map scale, which is usually required for topographic maps, but it comes pretty close. When we take into account that most topographic maps are just resampled from hand-digitized analog maps that in turn have been produced with measurement points many of which have been taken at distances even farther than 90 meter, we will probably come closer to true ground than many traditional topographic maps.
Get The Data
Ok, for Croatia as the topomap location, we get SRTM column 40 and row 4.
We download that area from the terrain server “Schorsch”, which is my mirror of the SRTM v4 data kindly provided by the NASA:
http://schorsch.efi.fh-nuernberg.de/data/terrain/SRTM/v4/srtm_40_04.zip
We unzip the archive and get the TIFF file “srtm_40_04.tif” in the subdirectory srtm_40_04.
Preview The Data
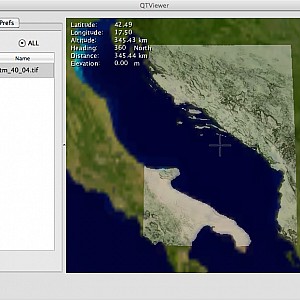
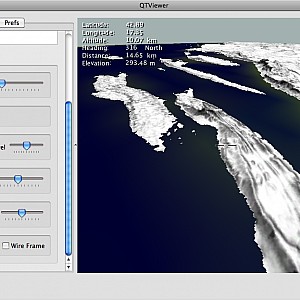
We drag the TIFF file into the open source application QTViewer.
On the left you see a list of imagery and elevation layers that have been dragged into the viewer. On the right you see a 3D preview of the layers.
A bit of northern Croatia is missing from the preview, since it is not covered by SRTM tile 40×04, but tiles 39×03, 39×04 and 40×03. To cover a larger area, you can download and drag those tiles into the viewer, also.
Now we can interact with the data in the following way:
- Double-clicking at the layer in the list brings the respective layer into view.
- Another double-click rotates the layer up north.
- A single click in the 3D view centers the point under the cursor.
- A single click and drag rotates the 3D scene about the point under the cursor.
- Wiping pans and zooms in and out of the 3D scene.
Get The QTViewer
You can download a Windows executable from here. On Linux or on a Mac you need to compile from the sources as described here. A build example is given here. Please note that compiling the software from source is recommended only for software developers familiar with the Unix C++ and CMake tool chain.
Visualize The Data
In the list view, right click at the layer and select “resample all” from the context menu. This creates a shaded relief representation of the scene in true 3D.
This will take a while until it finishes. Please be patient and monitor the progress in the status area below the list view.
After about 15 minutes a so called tileset has been created and is showing up as another layer in the list view.
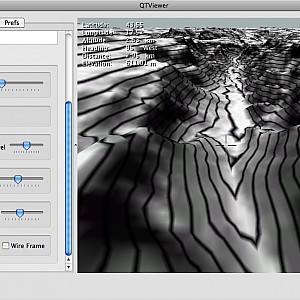
To adjust the 3D settings switch to the “Prefs” Tab, select “Show Controls”, switch back to the “View” Tab and enable “Contours”. You may also enable “Exaggeration” of the contoured elevation. When you navigate in the 3D view it will look like the following:
Cropping The Data
In the following we are restricting our area of interest to the coast line between Dubrovnik, Makarska and Split.
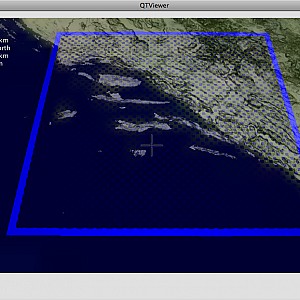
Right click at the layer in the list view and select “create extent”. This creates a draggable area selection box shown as “extent” in the list view. Hold the Cmd-Key (Mac) and drag the blue boundaries in the 3D view so that the selection box matches the area of interest. When you drag the corners you may rotate the selection box.
Now we right click at the extent and select “crop elevation to layer” to crop the SRTM elevation to our selection box.
The cropped layer is saved under the name “extent_*” in the export path of the viewer, which can be adjusted in the “Prefs” tab.
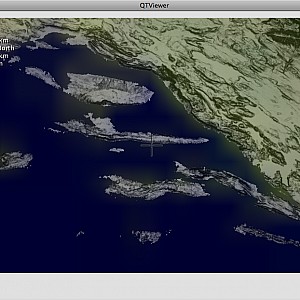
When dragging the cropped layer into the viewer it shows up as follows. You may also right click and select “toggle full-res” to show the layer at full resolution and not as thumbnail preview:
Now, that is beginning to look like a topographic map of Dalmatia.
Getting The Bathymetry Data
The SRTM database covers the entire land surface. However, the ocean is not covered by the SRTM mission, because the Space Shuttle radar cannot penetrate the water body.
To account for the ocean topography, also known as bathymetry, we need to take data from another database into account. We use the Smith&Sandwell database, which contains gravimetrically computed ocean depths at a resolution of 1km.
This is a pretty coarse resolution in comparison to SRTM data, but this is the best we can get for freely available bathymetry data. For certain areas like Hawaii, there is also bathymetry data available from sonar soundings and UUVs (Unmanned Underwater Vehicles).
We download the Smith&Sandwell data from Schorsch:
  http://schorsch.efi.fh-nuernberg.de/data/terrain/SmithAndSandwell/SmithAndSandwell_A3.bt
  http://schorsch.efi.fh-nuernberg.de/data/terrain/SmithAndSandwell/SmithAndSandwell_A3.prj
Then we merge the bathymetry with the SRTM data:
- Load the SRTM 40×04 tile
- Load the SmithAndSandwell_A3.bt tile
- right click at the SRTM tile and select “crop elevation to layer”.
- load the generated height field
- right click at it and select “toggle fullres”.
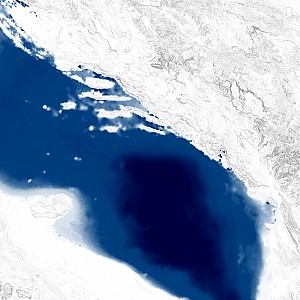
Now we produce a map of the elevation data to make the ocean appear blue and the land to appear white by choosing “colormap ocean” from the context menu:
Mapping The Data
Creating a topographic map means that we first need to create a topographic overlay, which consists of a shaded relief background and a contour overlay of the respective elevation layer.
In the context menu, we select both “shade layer” to create a shaded relief map and “contour elevation” to create a contour overlay. As an alternative to the shaded relief map we can create a colormapped relief via “colormap layer”. The three resulting images are shown in the following:
Creating The Overlay
With the three shaded, contoured and color-mapped images we create the topographic overlay. We can either blend the contour over the shaded relief or over the color-mapped relief.
For that purpose, we load the two respective layers into the viewer. We refer to them as background and foreground. We click at the background layer, press ‘Enter’ to select it and right-click at the foreground layer, choosing “blend actual over selected layers”.
Using The Overlay
The overlay contains the topographic information of the landscape, but it does not contain man-made features like roads, houses etc.
To account for that, there are two basic sources of man-made features:
- land register databases
- satellite imagery
The first category is available from sources like openstreetmap.org and openseamap.org.
The second is available world-wide at resolutions of up to 15m from the Landsat satellite series. However, the data is not available in a readily usable format, but rather in spectral bands varying from thermal to infrared and visible wave lengths.
The Landsat bands have to go through several pre-processing steps that are described in my project Open Satellite Data to yield true-color satellite imagery.
On the other hand we are not interested in true-color imagery for our topographic maps, but rather in land coverage information, meaning that we want to have a classification into vegetation (forests, grassland) and man-made structures(roads, buildings, acres).
Usually this requires databases like openstreetmap.org that are built from cadastral information sources.
We do not want to rely on those information sources, since in many areas and the third world they are pretty much out-dated or even non-existing.
But, fortunately, we can compute the so called NDVI (Normalized Difference Vegetation Index) from the red and infrared spectral bands of the Landsat imagery. The NDVI is a measure for bio-activity. In this index, man-made structures are black, since there is almost no bioactivity, while grassland is grey with medium bio-activity and forests and especially rain-forests are bright due to high bioactivity.
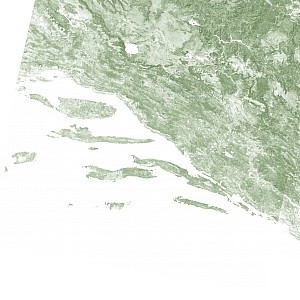
To get a map of man-made features world-wide, we simply invert the NDVI. I call that a NMMI, the Normalized Man-Made Index. We additionally give the black areas, which now account for vegetation in the NMMI, a greenish tint.
So here is what we need to do to get a NMMI map for Croatia:
Getting The Satellite Imagery
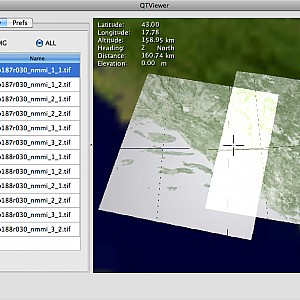
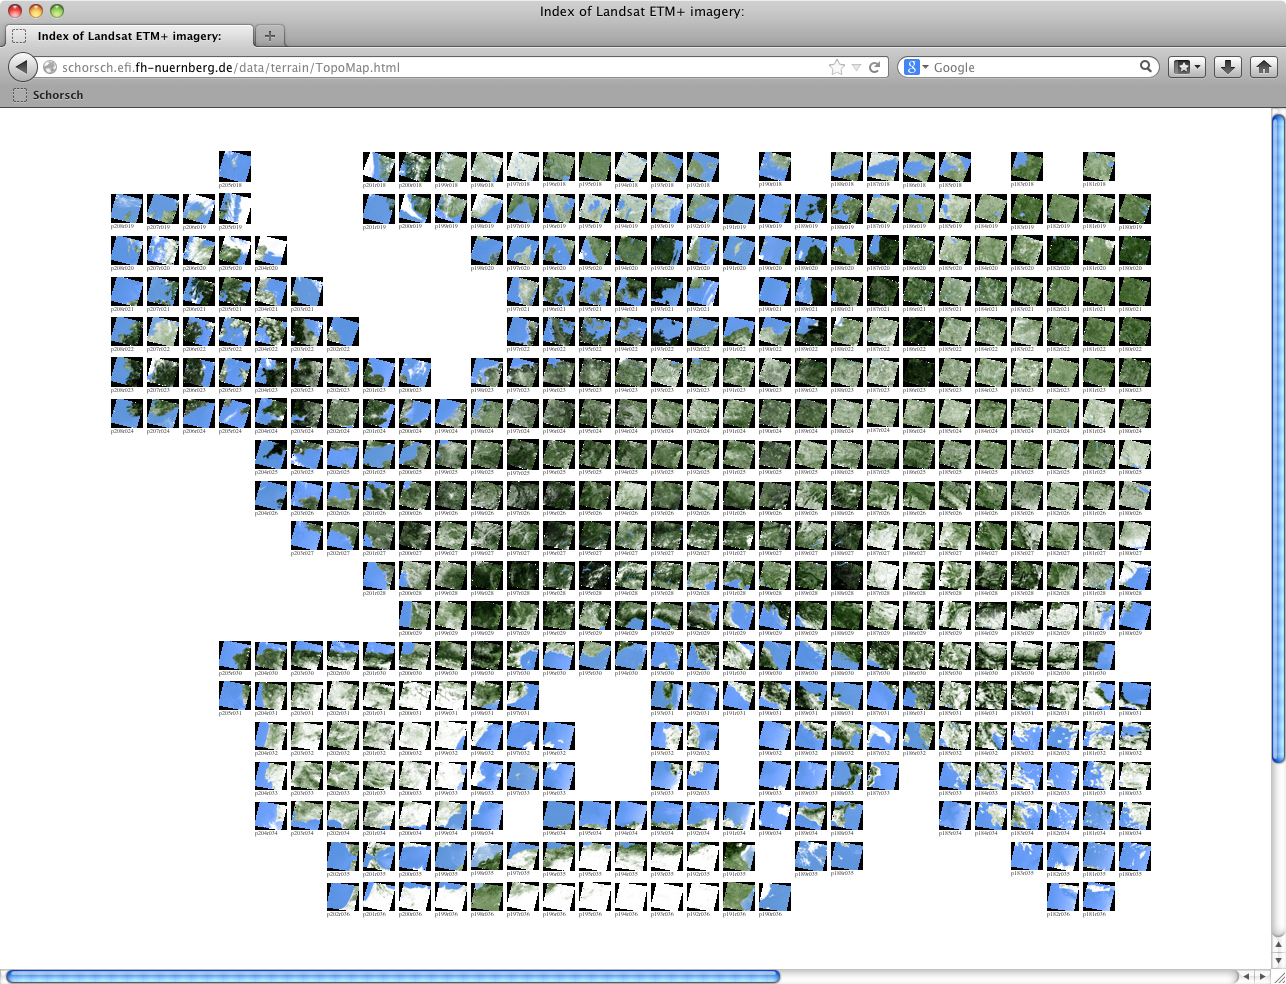
Landsat imagery is organized in paths and rows (see map on the right).
For Croatia we get path 187 / row 30 and path 188 / row 30.
First, we download the gnuzipped red (named *nn30*.tif.gz) and near-infrared (named *nn40*.tif.gz) TIFF bands of the respective Landsat patches from the mirror at “Schorsch”, which hosts a subset of the GLCF EarthSat original Landsat imagery:
  http://schorsch.efi.fh-nuernberg.de/data/terrain/Landsat/EarthSat/p187r030_nn30.tif.gz
  http://schorsch.efi.fh-nuernberg.de/data/terrain/Landsat/EarthSat/p187r030_nn40.tif.gz
  http://schorsch.efi.fh-nuernberg.de/data/terrain/Landsat/EarthSat/p188r030_nn30.tif.gz
  http://schorsch.efi.fh-nuernberg.de/data/terrain/Landsat/EarthSat/p188r030_nn40.tif.gz
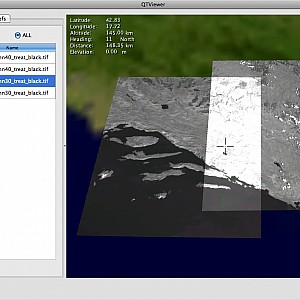
Next, we fix the black frame around the original imagery and make it transparent: Drag all TIFF files into the viewer, right click at them and select “treat black as transparent”.
The modifications are treated as jobs, which are appended to a job queue and processed in the background one after another. Please be patient until all pending jobs have been processed.
Next, we clear the layer list and open the modified layers with the suffix “_treat_black”.
We see that the Landsat paths overlap partially:
Creating The NMMI
Now we select pairs of *nn30* and *nn40* files and choose “compute nmmi from two selected channels”. This generates a NMMI imagery tileset for each pair.
The resulting NMMI imagery is grayscale. In order to color it, we open and right click at each image and choose gamma from the context menu. The default gamma settings are 1.2,1.6 and 1.0 for the red, green and blue channels, which gives the areas of the NMMI images, which correspond to vegetation, e greenish tint.
And finally, we merge all the colored NMMI tiles together to yield a single image and crop it to the extent of the SRTM crop area:
- open the SRTM tile
- open all colored NMMI tiles
- right click on the SRTM tile and select “create extent”
- right click at the created extent and select “crop imagery to layer”
The result below shows the NMMI on the left and the previously computed topographic overlay on the right:
Please note that the images above have been reduced to a quarter of the original size, to get reasonable displayable sizes.
Putting Things Together
Now we have a shaded relief map, a contour map and a nmmi map:
For the contour map we adjust the contour spacing in the “Params” tab. The default spacing is 100 meters, in the following we choose 250 meters.
We put those three maps together in two steps:
1) We mix the relief with the nmmi by selecting the relief. A right click on the nmmi brings up the context menu, from which we choose “mix actual with selected layers”.
2) We blend the resulting image with the contour by selecting the resulting image. A right click on the contour brings up the context menu, from which we choose “blend actual with selected layers”.
Here is the resulting topographic map of Croatia:
When we repeat the steps above with the colormapped alternative to the shaded relief we get the following colormap of Croatia:
Beefing Up The Map
Principially, the above map of Croatia demonstrates that topographic maps can be created with free software and with freely available data. The map, however, still lacks the following properties with room for optimization:
- spatial resolution
- contrast
- water features
- cloud artifacts
In the following we are going to tackle the above points.
Beefing Up The Spatial Resolution
The Landsat satellite imagery has a spatial resolution of 30 meter for the bands that we used for the NMMI calculation. The Landsat satellite also offers a panchromatic channel with a resolution of 15 meters. It has double the resolution but it is grayscale imagery that does not exhibit spectral information for the NMMI calculation. So for the NMMI it is useless.
But without going into too much detail we can alter the NMMI (normalized MMI) into the so called MMI (non-normalized MMI) so that we can merge the panchromatic channel with the MMI information. This is similar to the so called pansharpening technique (also called the Brovey transformation), which effectively doubles the resolution to 15 meter.
To compute the pansharpened MMI we need the red, green, blue, near-infrared and panchromatic Landsat ETM+ bands with the file name infixes nn30, nn20, nn10, nn40 and nn80, respectively.
We download the five channels for the Landsat path 188 and row 30:
  http://schorsch.efi.fh-nuernberg.de/data/terrain/Landsat/EarthSat/p188r030_nn30.tif.gz
  http://schorsch.efi.fh-nuernberg.de/data/terrain/Landsat/EarthSat/p188r030_nn20.tif.gz
  http://schorsch.efi.fh-nuernberg.de/data/terrain/Landsat/EarthSat/p188r030_nn10.tif.gz
  http://schorsch.efi.fh-nuernberg.de/data/terrain/Landsat/EarthSat/p188r030_nn40.tif.gz
  http://schorsch.efi.fh-nuernberg.de/data/terrain/Landsat/EarthSat/p188r030_nn80.tif.gz
We drag and drop all five channels into the QTViever application.
For the channels nn10, nn20, nn30 and nn40 we choose “treat black as transparent”, but not for the nn80 panchromatic channel, because the layer is too large to fit well in 32bit memory.
We clear the four treated channels, reopen them, right click and choose “select all”, then right click again and select “compute mmi from five selected channels”.
The result is a tileset with 5×4 tiles of the pansharpended MMI at 15m spatial resolution.
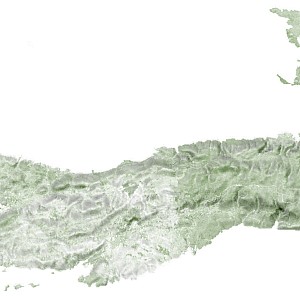
Here is a small inset for the island of Korcula at original resolution mixed with a shaded relief of the same area (as with NMMI imagery the MMI image has been colored via gamma correction):
Note: For automatization purposes the above mmi computation can be achieved on the command line with the merger tool of libGrid as follows:
merger band8.tif band4.tif band3.tif band2.tif band1.tif result.tif -tilesize=0 -method=1
Be sure to use the merger tool on a 64-bit system like Ubuntu 13.10, since it usually requires more than 3GB of memory to process an average Landsat patch as a whole.
Beefing Up The Contrast
To enhance the contrast of a layer we right click at it and choose “contrast enhancement” from the context menu. This operation is affect by the “black level”, “white level” and “contrast linearity” parameters adjustable in the “Params” tab.
The black level value defines the threshold below which all values become black after the contrast operation. The white level value defines the threshold above which all values become white. The contrast linearity parameter defines the smoothness of the color transition from black to white values. A linearity value of 1.0 yields a smooth transition. A linearity value of 0.0 yields a sharp and contrasty transition.
Side note: The inversion of an image is a special case of contrast enhancement with black_level=1.0, white_level=0.0 and linearity=1.0.
In the previous sections we have seen that we can use gamma correction to colorize grayscale imagery. Gamma correction can also be used to improve the contrast of the created imagery.
For that purpose we choose a particular gamma value for all red, green and blue channels in the “Params” tab, right click on the layer to be contrast enhanced and choose “gamma” from the context menu. A gamma value less than one (e.g. 0.7) makes dark colors appear darker, whereas a gamma value greater than one (e.g. 1.4) makes dark colors appear brighter.
Beefing Up The Feature Richness
The topographic map, so far, is mainly based on the vegetation index, from which we draw the conclusion that non-vegetated areas must be man-made. Mathematically speaking, this property is necessary, but not sufficient to discriminate other non-vegetated areas from man-made areas. Other non-vegetated areas which appear bright with a high NMMI value are:
- barren land
- open water
- clouds
To distinguish those from eachother, we need to have a look at the full spectrum response that is available from the Landsat 7 satellite:
| Landsat 7 spectral bands | Wave length in micrometers | Name | Spatial resolution in meters |
| Band 1 | 0.450 – 0.515 | Blue | 30 |
| Band 2: | 0.525 – 0.605 | Green | 30 |
| Band 3: | 0.630 – 0.690 | Red | 30 |
| Band 4: | 0.760 – 0.900 | Near IR | 30 |
| Band 5: | 1.550 – 1.750 | Mid IR | 30 |
| Band 6*: | 10.40 – 12.5 | Thermal | 60 |
| Band 7: | 2.080 – 2.35 | Mid IR | 30 |
| Band 8: | 0.52 – 0.92 | Pan | 15 |
| * Band 6 is split in high and low gain |
In particular the the thermal and mid-infrared bands are helpful to discriminate land features based on the following characteristics:
- Barren land has a balanced response in the visible and infrared bands.
- This is due to the highly diffuse BRDF of rock and stone.
- Open water has a high to medium response in the blue and green band (defining the color of water), a lower response in the red band, even lower response in the nir band, and even lower to zero response in the mid-infrared bands.
- In the visible and infrared range this is due to Rayleigh scattering in the water body and on the way from the water surface to the satellite.
- In the UV wave lengths water absorbs very well due to electronic absorption of the $H_2O$ molecule.
- Water contained in vegetation has a high response in the green spectrum but low response in the near infrared spectrum.
- Similar to the NDVI, the Normalized Difference Water Index is based on that observation: $NDWI = \frac{green-nir}{green+nir}$
- Clouds appear bright white in the visible spectrum due to diffuse scattering at water droplets.
- In the infrared spectrum clouds absorb most energy.
- In the thermal band clouds appear dark, since the are usually very high up in the atmosphere, where it is cool. This may not hold for clouds at low altitudes in tropical zones.
Based on the above characteristics, we can describe the following land features using Landsat bands 1,2,3 and 4:
- Clouds are discriminated by high intensities of bands 1, 2 and 3 and a high absolute band difference of band 3 and 4. This is known as DCI, the Difference Cloud index.
- Side Note: The DCI is very conservative and only catches a fraction of the cloudy area. To catch clouds more accurately the DCI needs to be enhanced with the mid infrared and thermal bands.
- Open water is discriminated by a high positive difference of bands 1 and 2 with band 4. This is known as DWI, the Difference Water index.
We can calculate all the above indices with the QTViewer:
- Load all bands (bands 1,2,3,4,8) of a particular Landsat path and row into the QtViewer.
- Select the appropriate bands.
- Choose the respective index computation from the context menu (NDVI, NMMI, NDWI, MMI, DCI or DWI).
Now we take the DCI and DWI indices to beef up the MMI using the following algorithm:
- MMI areas with high DCI values become transparent.
- MMI areas with high DWI values become blue.
The above algorithm computes a topo map from Landsat bands 1,2,3,4 and 8 where
- vegetation is green
- open water is blue
- barren land and man-made features are white
- clouds are transparent
To do so, we load the Landsat bands 1,2,3,4 and 8 in the QTViewer, select all five bands, right click at the list view and select “compute topo map” from the context menu.
Here is the result of a topo map operation for the island of Korcula mixed with a shaded SRTM relief of the same area:
On the command line the merger tool achieves the same result:
merger band8.tif band4.tif band3.tif band2.tif band1.tif result.tif -tilesize=0 -method=2
Method 2 corresponds to topographic color-mapping, method 1 corresponds to mmi output, and method 0 to true-color output.
Europe-wide browsable Landsat topography map:
To see the topographic imagery in 3D see the Europe Showcase.
